 Injury Master
 Claims Master
 Premium Master
 Data Master
 Master Apps
Dashboard
The Dashboard is an account level summary of incident and claim activity. This will be reflective of whichever company / companies are selected in the Company filter of the Blue Bar.
The Dashboard can be returned to at any time by selecting DASHBOARD in the Navigation Bar.
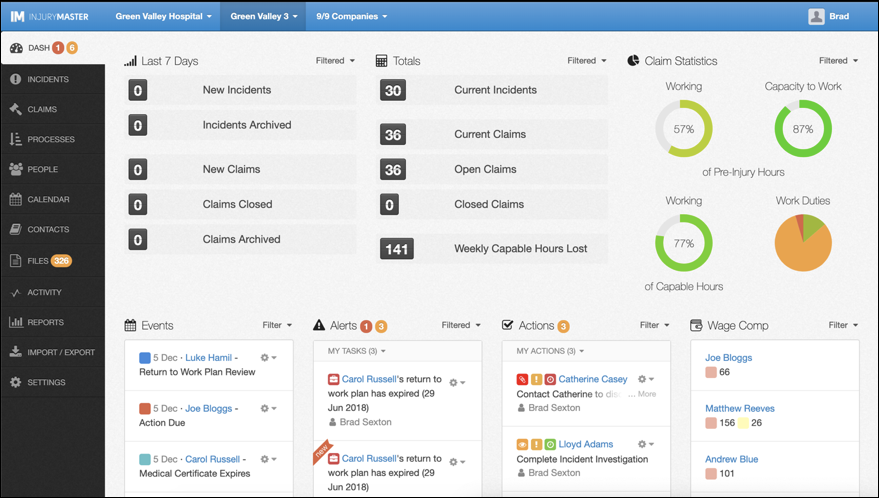
Incident & Claim Metrics
The Dashboard Incident and Claim Metrics show summaries of recent and total incident and claim activity. Selecting a metric from either column (e.g. New Claims), will redirect you to the list of the specific incidents / claims that contribute to the chosen metric.
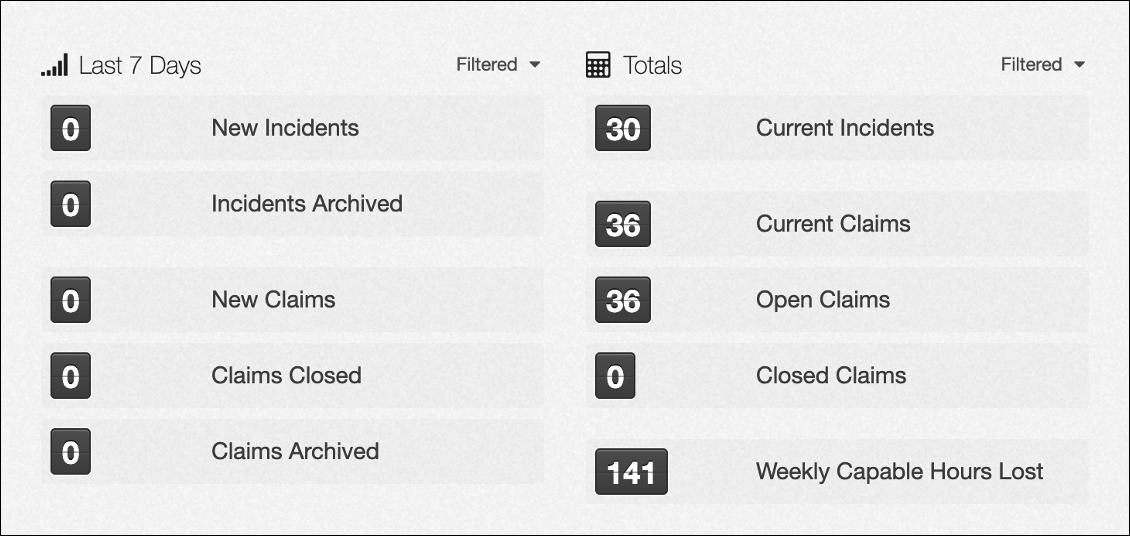
Metric Types
The recent metrics column (left) provides counts of New Incidents, Incidents Archived, New Claims, Claims Closed and Claims Archived.
The totals metrics column (right) provides counts of Current Incidents, Current Claims, Open Claims, Closed Claims, and Weekly Capable Hours Lost.
Weekly Capable Hours Lost is a metric that calculates the number of hours that workers do NOT work each week, when they have a capacity to work. For example, if a certificate shows a capacity to work 38 hours but the worker is only working 30 hours, then they will contribute 8 hours to the ‘Weekly Capable Hours Lost’ count.
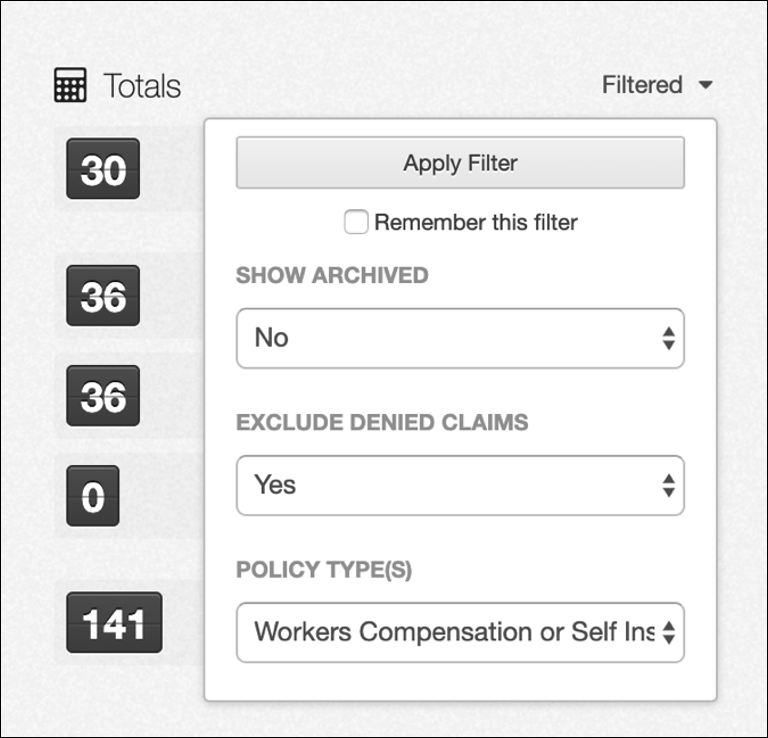
Filtering Metrics
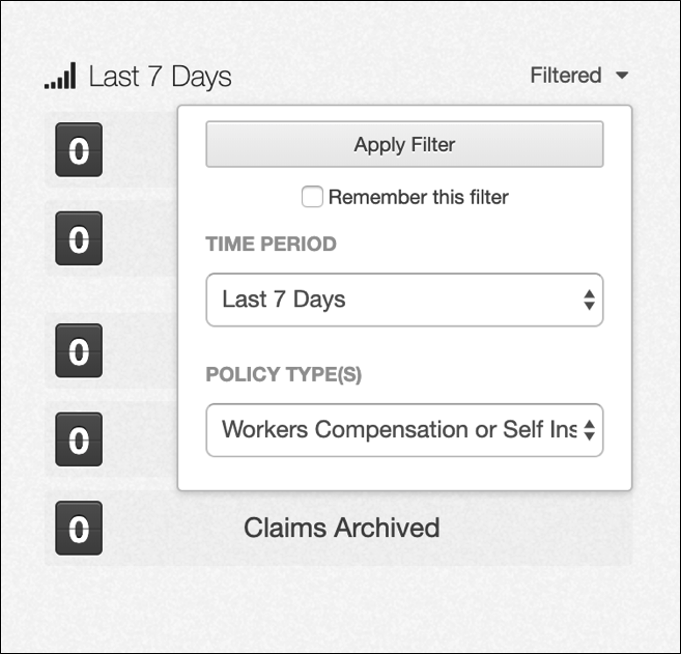
Recent metrics can be filtered by Time Period – either Last 7 Days (default), Last 4 Weeks, or Last 12 Months – and by claim Policy Types (defaulted as Workers Compensation or Self Insurance). (See Policies for definitions of Policy Types.)
Totals metrics can be filtered to include or exclude ‘archived’ records and denied claims (both excluded by default), and also by claim Policy Types (defaulted as Workers Compensation or Self Insurance).
Claim Statistics
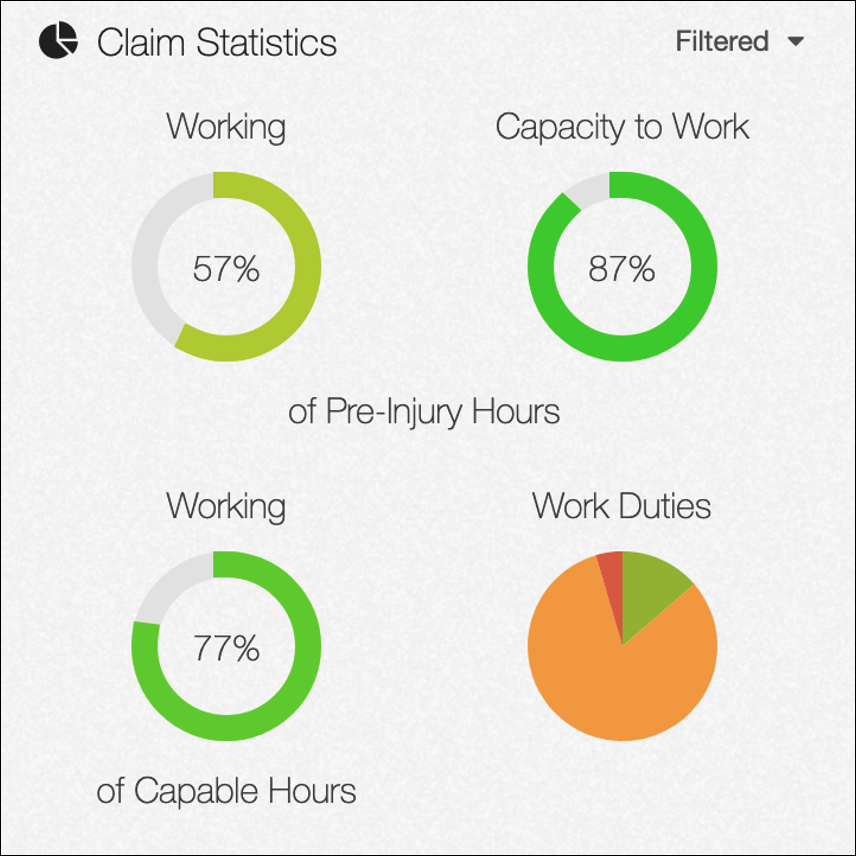
The Dashboard Claim Statistics provide working capacity information for all workers on workers compensation claims.
Viewing Dials
Claim Statistics are made up of four dials showing the following:
- Working of Pre-Injury Hours - total hours worked per week as a percentage of pre-injury average hours.
- Capacity to Work of Pre-injury Hours - certified hours of medical capacity per week as a percentage of pre-injury average hours.
- Working of Capable Hours - the hours worked as a percentage of medically certified ‘capable hours’ worked.
- Work Duties - a percentage breakdown of the types of duties worked – pre-injury (green), modified (orange), permanently modified (blue), or fully off work (red).
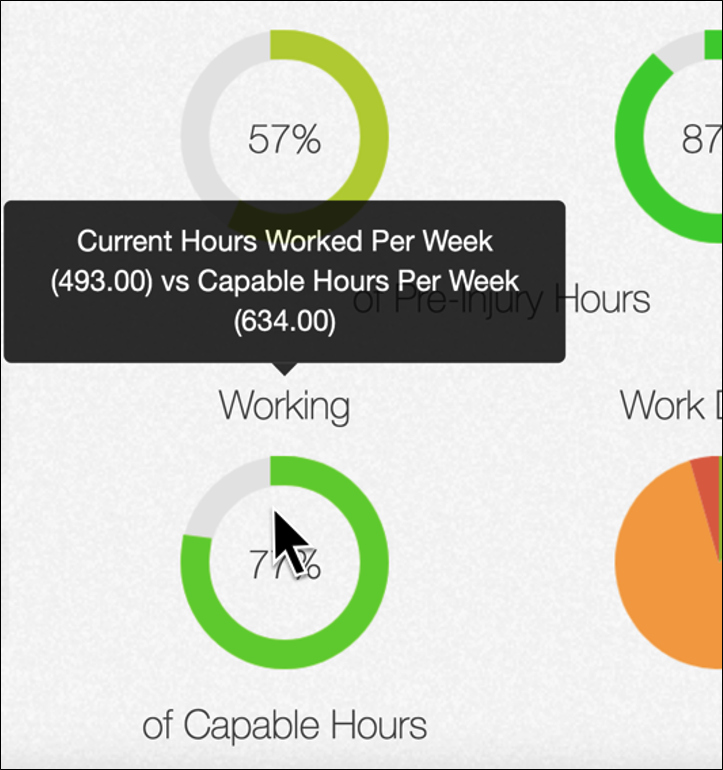
Hovering mouse over dials 1, 2 & 3 (see left image) provides further description including total hours as a number value.
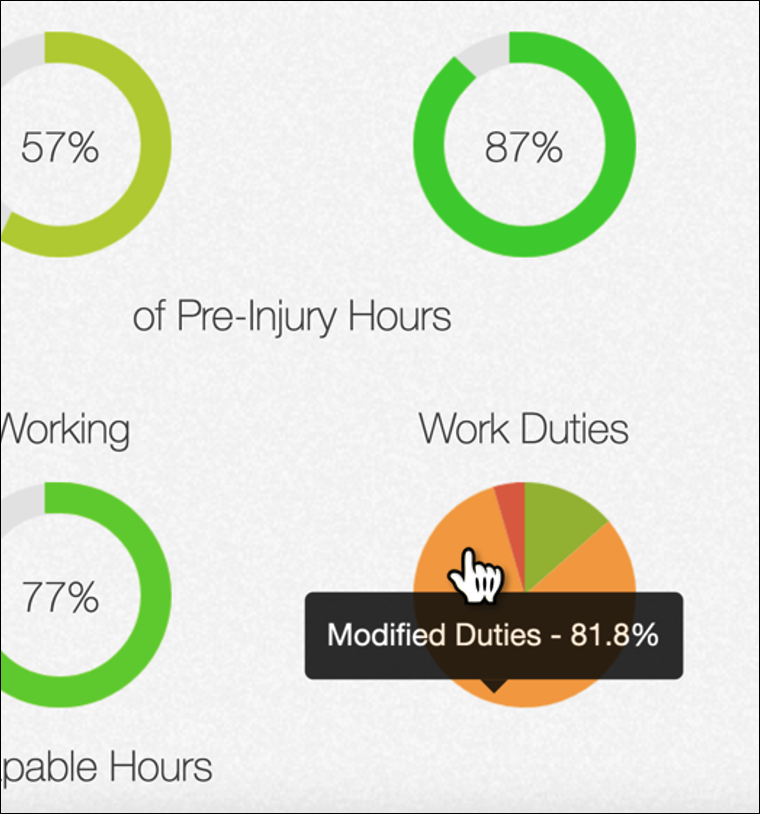
Hovering the mouse over a portion of the Work Duties dial (see right image) reveals the work duties type and percentage of claims contributing to that type (e.g. Modified Duties – 81.8%). Selecting one of these portions will redirect you to the list of claims that contribute to the chosen work duties type.
Filtering Statistics
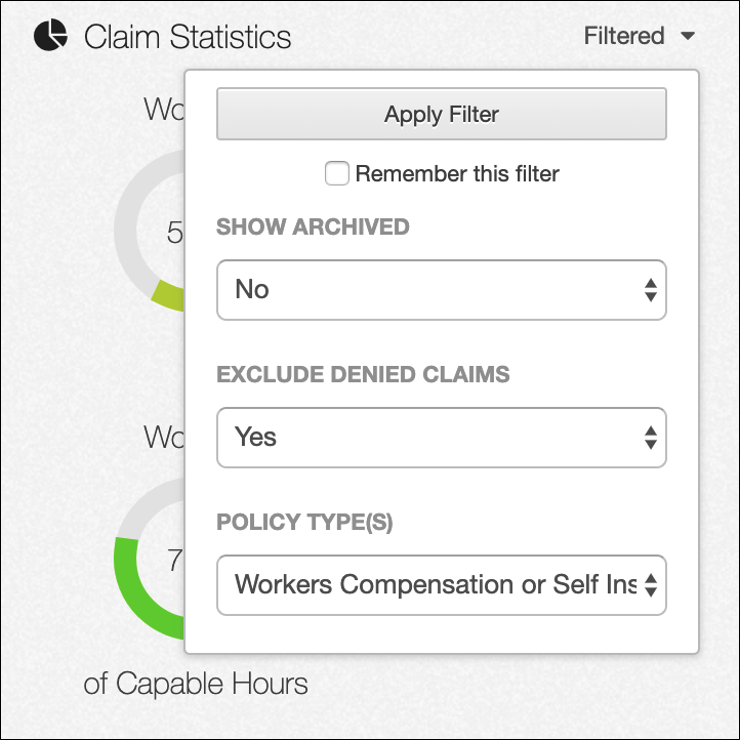
Claim Statistics can be filtered to include or exclude ‘archived’ records and denied claims (both excluded by default), as well as by Policy Types (defaulted as Workers Compensation or Self Insurance). (See Policies for definitions of Policy Types.)
Other Summary Information
The Dashboard also contains summaries of more specific incident / claim details in the following areas:
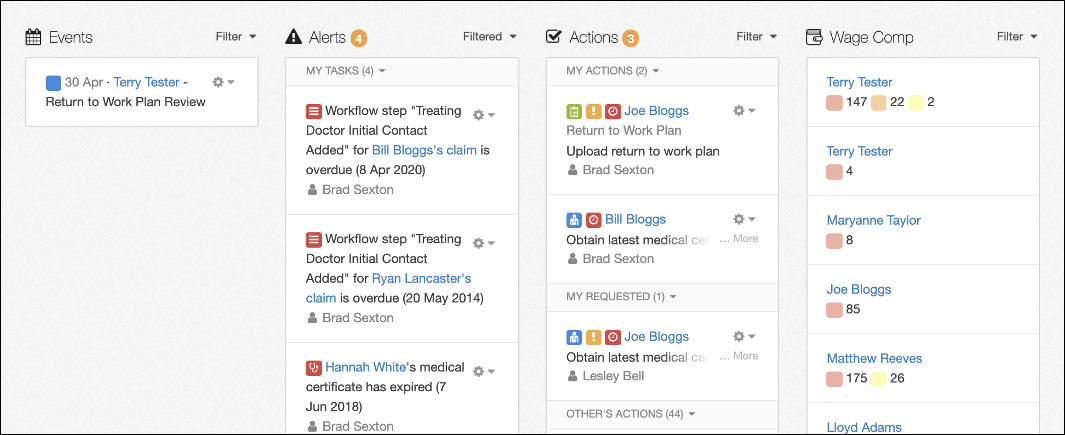
- Events – Upcoming calendar entries including medical certificate expiry dates
- Alerts – List of activities including outstanding tasks for completion, such as workers medical certificate due to be updated or overdue
- Actions – List of assigned actions that are due for completion
- Wage Comp – Outstanding compensation periods for all claims
Select any section from the above list for further information.